Know exactly where you stand.
Benchmark your carbon performance against your sector and the wider market, so every climate decision is grounded in real data, not guesswork.


Ask the hard questions. Get easy answers.
A clear view of your carbon performance, in context.
See where you stand against your industry and the wider market, and turn it into something your boardroom and tenders will trust. No data team required.
Tailored to your industry
Your carbon health score reflects your sector, so the comparison is always fair.
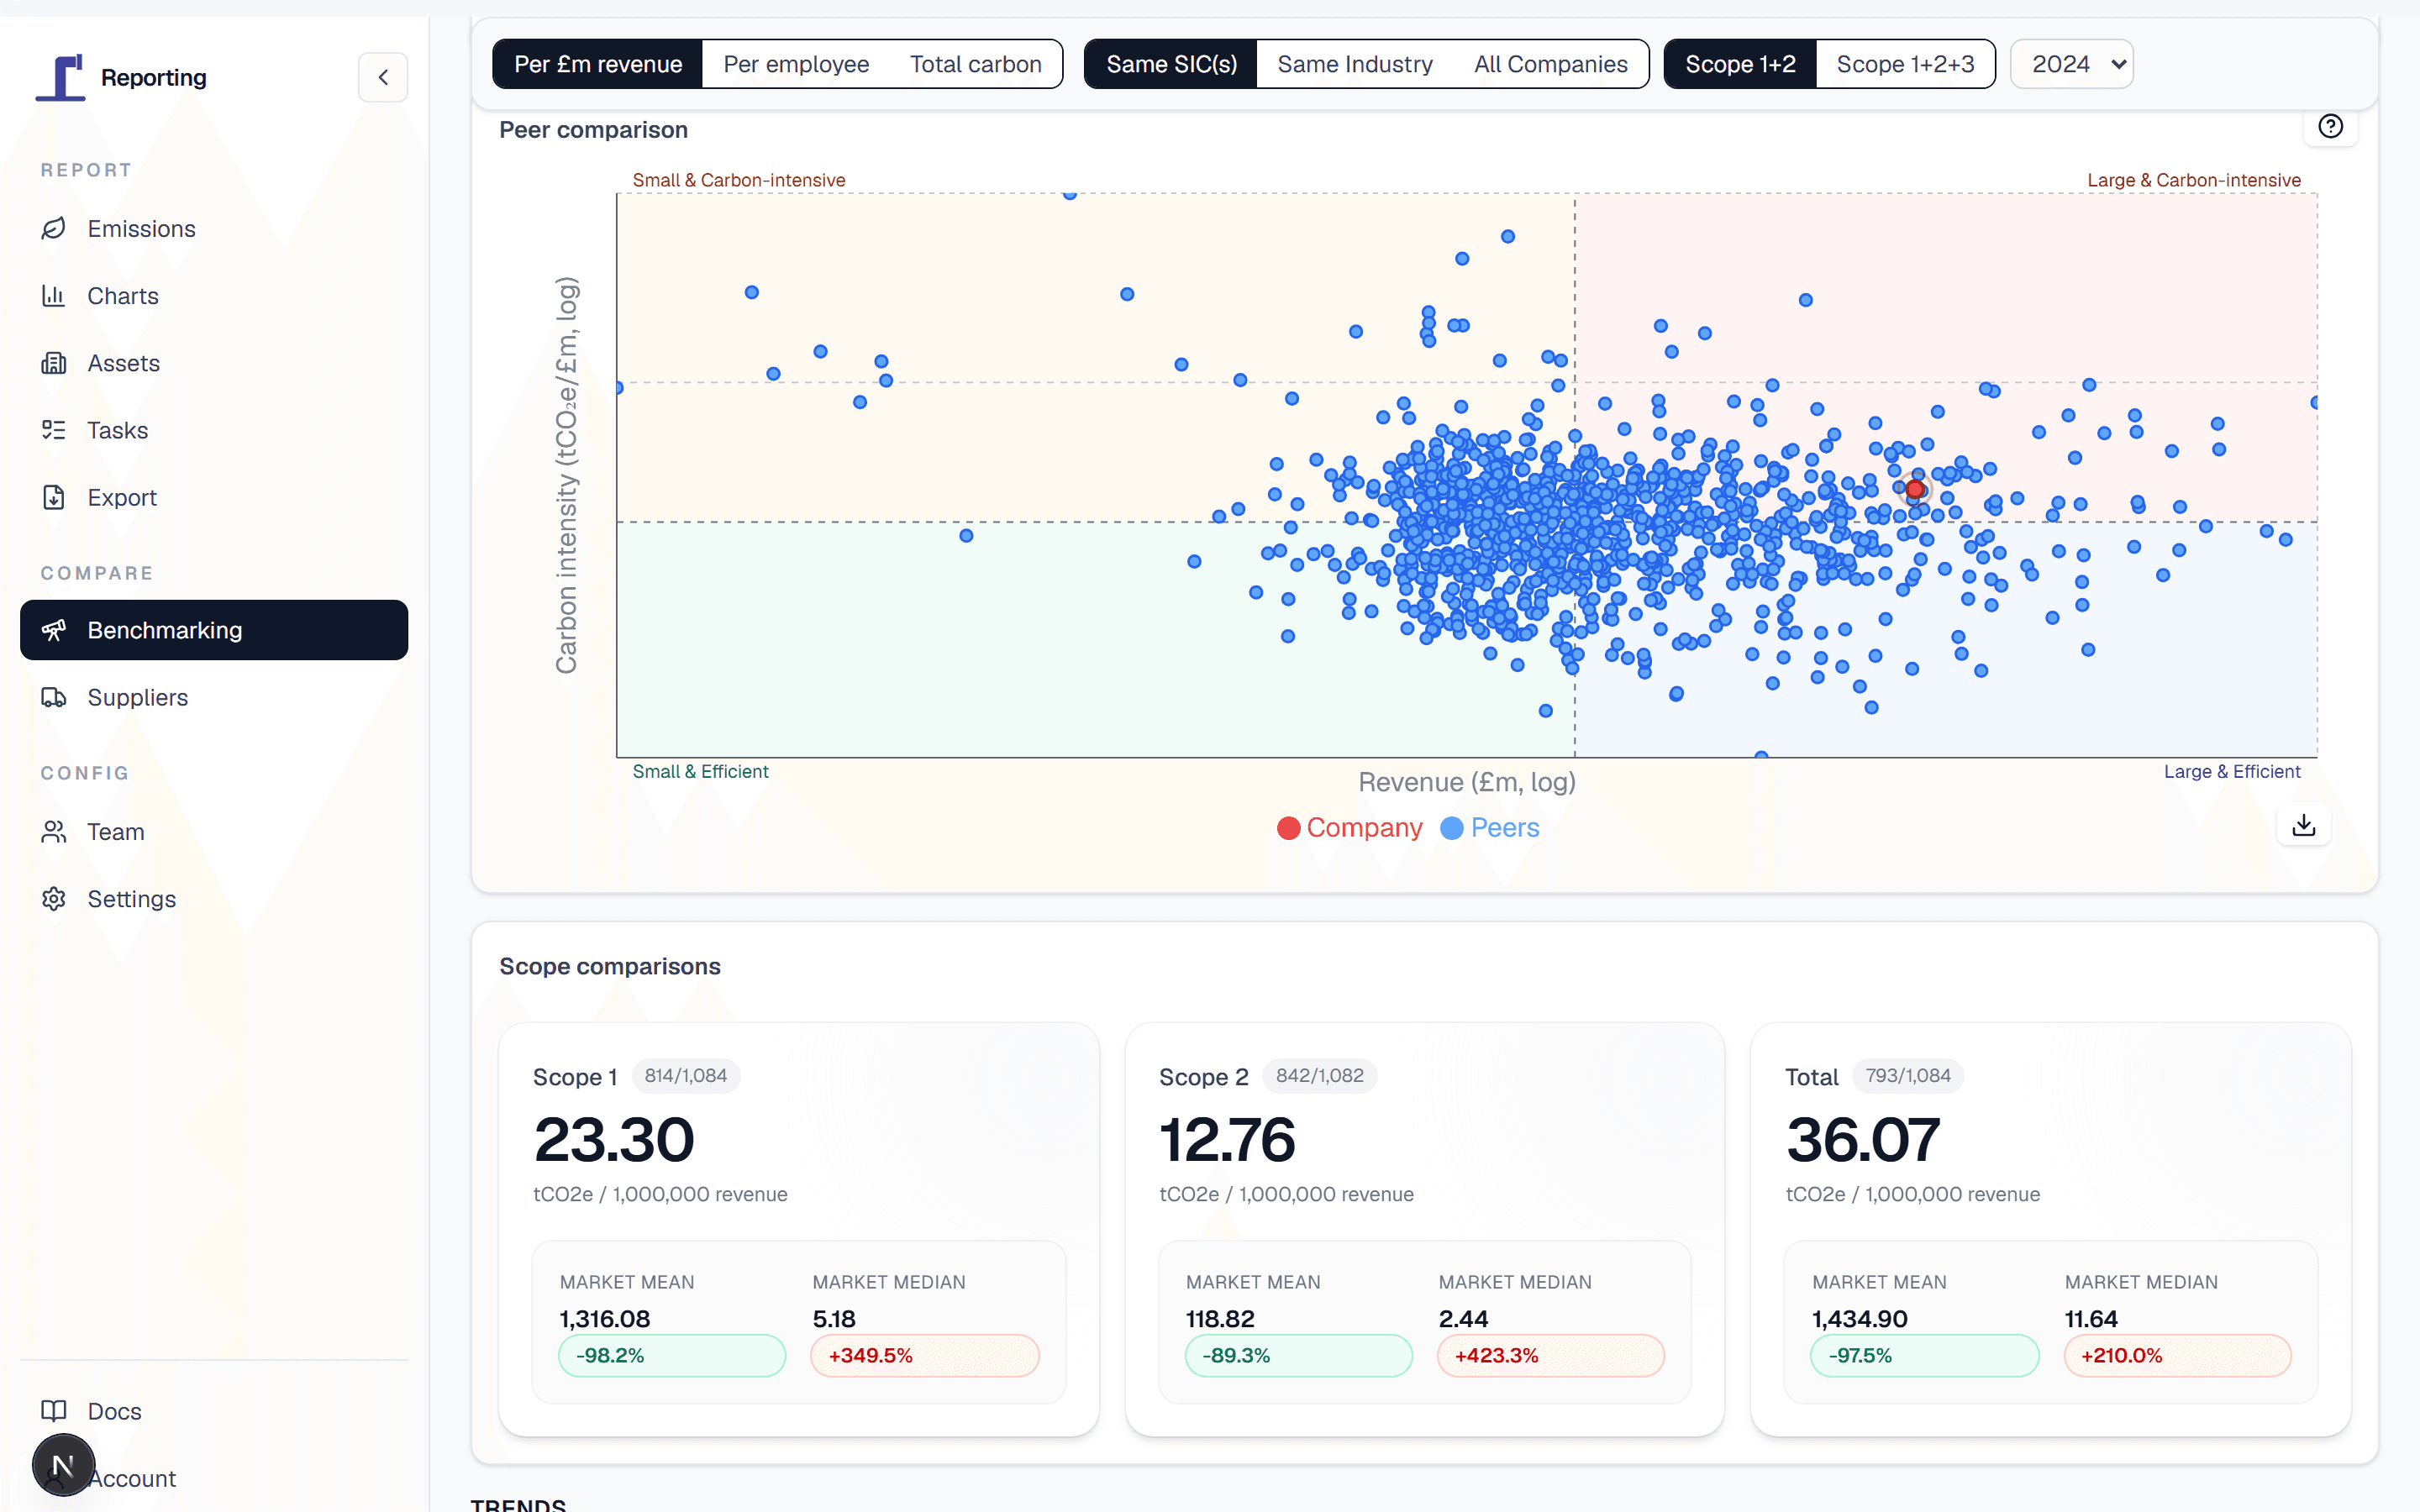
See how you really compare
Position your performance against peers, market leaders and the sector average.
Easy, meaningful reporting
Turn complex carbon data into a clear report your board actually understands.
Boardroom & tender ready
Walk into reviews and bids with credible, defensible numbers behind you.
Historic trends
Track your trajectory across the years and prove momentum, not just a snapshot.
Compliance ready
Built for bids, audits and renewals, with evidence kept close to every figure.
Share interactive reports, not slide decks.
With one click, share your carbon report with stakeholders, boards and customers, a live link, not a static PDF that's out of date the moment you send it.
See your performance in living colour.
Periscope turns complex carbon data into clear, visual stories, the kind people remember after the meeting.
Average emissions in the market
See how your overall emissions intensity compares with the average in your sector.
Benchmark range & leaders
Understand where you sit between laggards and leaders, with clear trend lines for the decisions you need to pick.
Scope & source breakdown
See which parts of your business are driving your footprint, and where action would matter most.
Key metrics & trajectory
Track emissions, intensity and reduction pace over time, against the targets you have set.
Competitive intelligence, plotted against your own.
View competitor carbon emissions and plot their performance directly against yours, drawn from one of the UK's most comprehensive carbon datasets.
More than just a dashboard.
Need tailored carbon statistics for your use case? Every customer can request bespoke data and analysis, free, to get the most from one of the UK's most comprehensive carbon datasets.
Benchmark a whole portfolio, or a whole supply chain.
Consultants & large portfolios
Benchmark, track and produce reports for every client in one place with a consultant membership.
Suppliers & supply chain
View your suppliers' carbon performance and climate initiatives, and check they align with your company.
From raw data to a live view in days.
Simple inputs, powerful benchmarking. Go from a spreadsheet to a live picture of your competitive position in days, not months.
Start for free
Sign up and get qualitative benchmarks for free, to see the lay of the land before committing.
Get your health score
See your carbon health score, where you sit on the spectrum, and exactly how you compare with your sector.
Share tender-ready outputs
Send a polished benchmark report to stakeholders, boards and bid teams in a single click.
Questions teams ask before benchmarking.
Try for free. Get your benchmark report today.
See where you stand in minutes, no data team, no slide decks, no guesswork.